New York City's subdivisions and their respective population size, housing units, and density
Map | data table | water sources
|
|
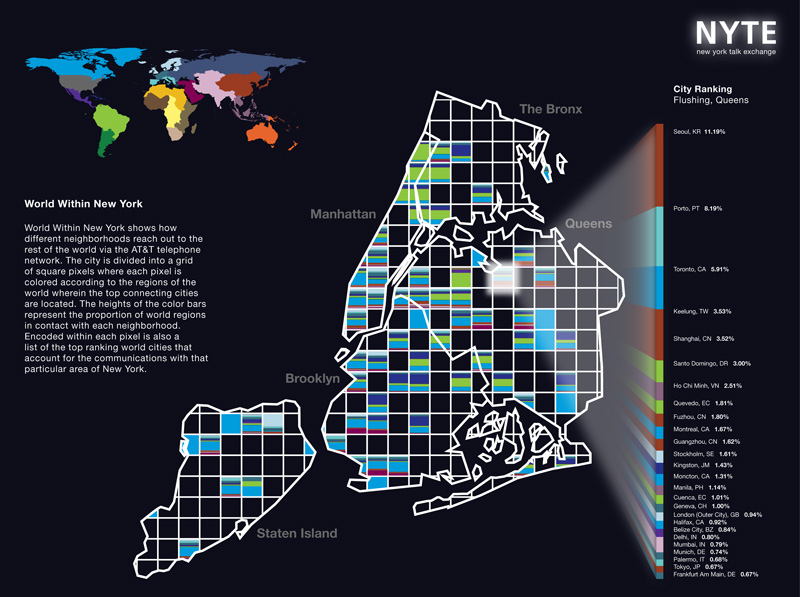
| The ties that the population of New York City has to the World. | |
|
|
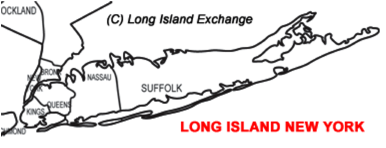
| Satellite view of New York City from Long Island. | The counties of southern New York State |
| county | population | % | housing units | median household inco | square miles | density | |
| Kings - Brooklyn | 2,532,645 | 1,000,293 | $43,567.00 | 70.82 | 35,761.72 | / sq mile | |
| Queens | 2,230,722 | 832,512 | $39,649.00 | 108.53 | 20,553.97 | / sq mile | |
| Suffolk | 1,489,816 | 569,985 | $84,506.00 | 912.05 | 1,633.48 | / sq mile | |
| Nassau | 1,344,436 | 468,346 | $93,613.00 | 284.72 | 4,721.96 | / sq mile | |
| Long Island | 7,597,619 | 39% | 2,871,136 | 1376.12 | 5,521.04 | / sq mile | |
| Manhattan | 1,601,948 | 8% | 847,890 | $64,971.00 | 22.83 | 70,168.55 | / sq mile |
| City of New York | 8,244,910 | 39% | |||||
| 9,199,567 | 47% | Square miles | |||||
| State of New York | 411.2 | persons / sq. mile | 47,126.40 | ||||
| 19,465,197 | 8,108,103 | $55,603.00 | 413.04 | / sq mile | |||
| http://censtats.census.g | Area | ||||||
|
Map | Social Sciences Index | data table
|
|||||||